
How fluent is your business in the language of Google Analytics?
With Google turning everything they touch into gold, practically everyone with a website is trying to learn Google Analytics. If your business hasn’t jumped on that bandwagon yet- don’t worry, it’s not too late!
Get started with the following 4 core techniques used to analyze Google Analytics.
1. Segmentation
Examining aggregated data helps your business understand trends and your audience’s purchase process. In order to determine why these trends happen or change, it’s important to segment your data.
Data aggregation: A collection of data expressed in a summary form for analysis.
Data segmentation: Aggregated data that is separated by specific qualities.
For example, a common way to segment your data is by marketing channels. This will allow you to determine which channels users are entering your website from, and which sources your business should be investing more into.
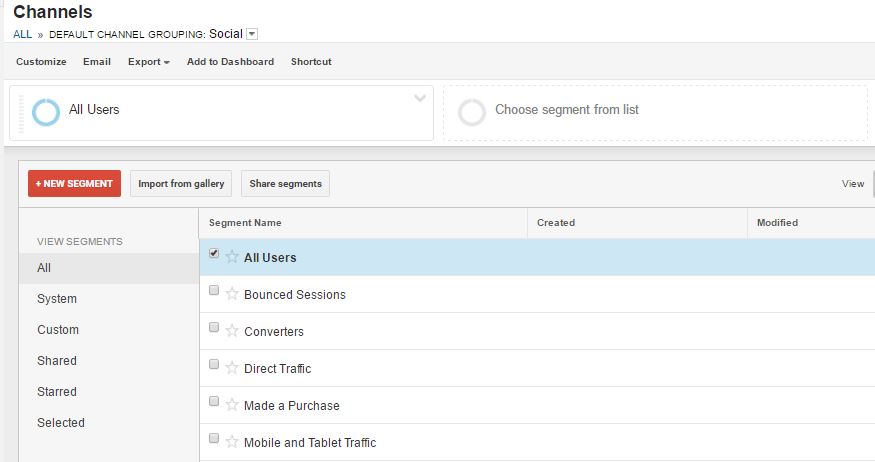
Pay close attention to the following segments when looking at your own data:
- Date and time. See how your audience behaves differently at different times.
- Device. Explore user performance across desktop, tablet, and mobile phones.
- Location. Determine which areas perform best.
- Customer characteristics. Look at first time customers versus repeat customers.
- Marketing channel. Compare the performance of your brand on different channels.
2. Context
Context allows you to understand how your website is performing.
There are two ways to set context:
Externally. Helps determine how your business is doing in comparison with other similar businesses. Can come from industry benchmark data.
For example, it would show if an improvement in your data is due to a general industry growth trend or something specific to your business.
Internally. Helps determine how your business is doing compared to it’s past performance. By setting historical data as a benchmark, you can use that benchmark to set key performance indicator targets (KPIs).
3. Conversions
Conversions are split into two categories; micro conversions and macro conversions. An example of a micro conversion could be a website visitor clicking on a call-to-action and downloading your whitepaper. An example of a macro conversion could be a visitor contacting your sales team.
A macro conversion is your end goal, and a micro conversion leads up to it.
So if a macro conversion is so important, why measure micro conversions at all? Well, these help your business to better understand your audience and the steps they take before making a purchase decision.
If users go through the same micro conversions and consistently end with a macro conversion, you will want to continue that same process.
4. Attribution
Attribution, a common term associated with conversion, is when you assign credit for a conversion. It allows you to understand which marketing channels are generating an optimal return on investment.
The most common kind of attribution is called last-click attribution. This means all of the value from the conversion is given credit to whichever marketing activity the user interacts with last before converting.
Last-click attribution has been used heavily in marketing analytics for years. Recent Google Analytics advancements have brought forward more attribution options.
Now, Google Analytics looks at all of the marketing activities users have interacted with, instead of just one. This is a breakthrough for businesses and marketers since we know the purchase process involves much more than one step. They call these other marketing interactions assists.
Here are a couple of other common model attributes:
First-click attribution, as you might imagine, is when all of the value from the conversion is given credit to the first marketing activity the user interacts with.
Linear attribution distributes the credit equally over the marketing interactions.
Attribution is most effective when used to see how different interactions work together for the desired outcome. Like a team, each activity has a role and a purpose.
These 4 techniques are at the heart of Google Analytics and important to grasp as you traverse it’s mountain of data. We’re here should you need a hand, Godspeed to you!


